Deploying the VMware Folding@home fling to join the worlds largest distributed supercomputer is a worthwhile and interesting pursuit. Scientific research will require a monumental number of person-years over a long period of time to develop treatments and a vaccine. Standing up the Folding@home software is only the first step. It will take a marathon to win this race.

My previous blog post described how to contribute home lab resources with a negligible impact on performance and responsiveness. This is only the first obstacle to overcome. When I was training for the marathon I “hit the wall” during a 20 mile training run. I lost any motivation to move another step once I depleted all of my energy stores. I learned from this experience and accepted every GU energy supplement offered during the race to finish the Seattle Marathon. Contributing computer resources to researchers isn’t sustainable if your electricity bill doubles. The fear of a large energy bill is also an example of “hitting the wall”. Beyond the personal financial impact, natural resources are inefficiently used if someone else can provide IT resources more efficiently.
Measurement
In 2003 I attended an event in Pasadena, CA where the late Peter Drucker spoke. Mr. Drucker has been described as “the founder of modern management”.

I learned during his speech how important measurement is to achieve organizational goals. I took his lesson and started measuring to understand whether donating computing resources was a sustainable activity for me. Next I needed to decide what to measure.
Measurement: Electricity usage
All servers, NAS, and networking infrastructure are plugged into a CyberPower CST135XLU UPS I bought at Costco. The UPS measures the electricity used by all of the equipment in the half-rack, not only the servers.
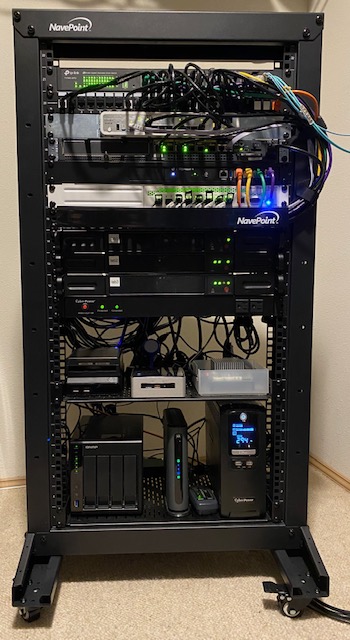
This UPS supports CyberPower’s PowerPanel Business VMware virtual appliance. It provides detailed reporting in addition to a graceful shutdown capability during a power outage to protect my vSAN datastore.
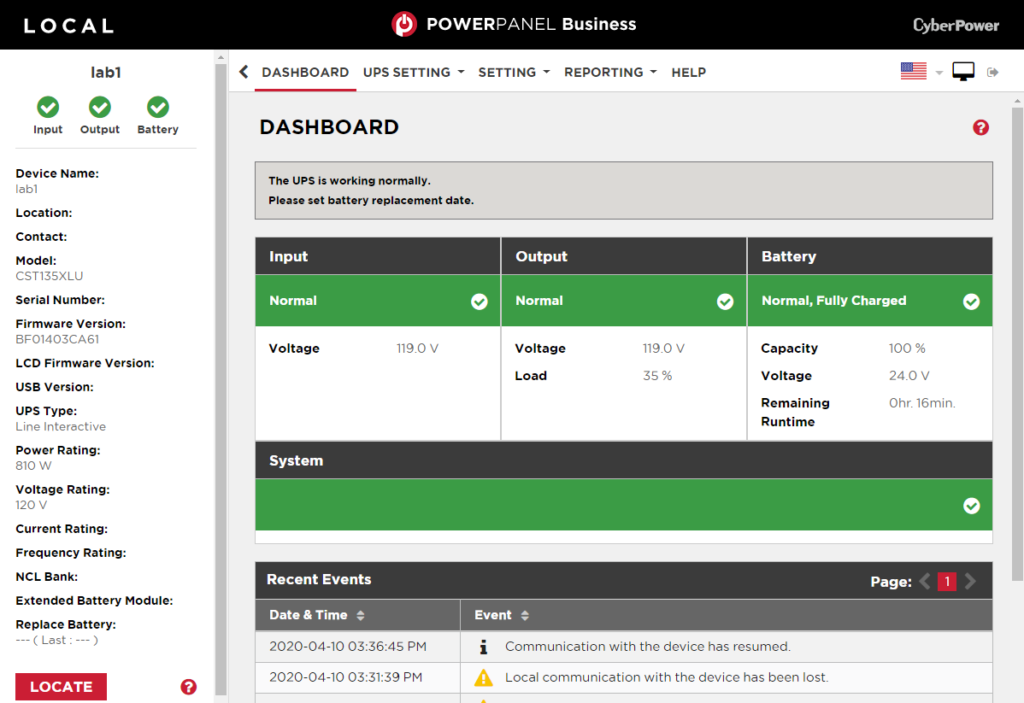
PowerPanel Business logs energy load percentage recorded every 10 minutes. Watts consumed is a calculation of the energy load percentage multiplied by total capacity of the UPS which is 810 watts. For example a reading of 35% energy load represents the use of 283.5 watts.
Transition from baseline to deploying Folding@home
An Excel pivot table is used to analyze the home lab energy usage data imported from the CyberPower UPS PowerPanel CSV file. The pivot table made it easy to graph, average and total electricity usage per day.
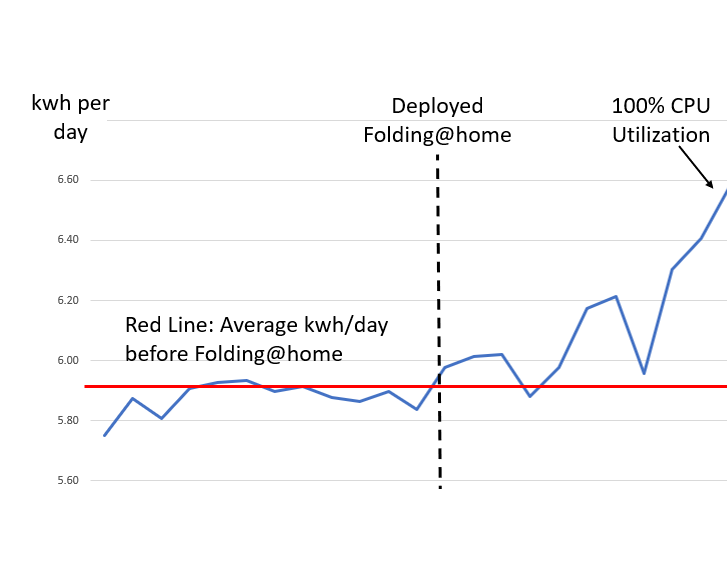
The graph shows both the lower baseline energy usage and how the energy usage increased after I began donating computing time to Folding@home and Rosetta@home. The dips shown after deploying Folding@home is due to the servers waiting for work units from protein researchers. After the work units are received the energy usage increases as the servers increase utilization. Finally, 100% CPU utilization results in increased energy usage after I deployed VMware Distributed Resource Scheduler using shares and adding Rosetta@home.
Measurement: Cluster compute capacity
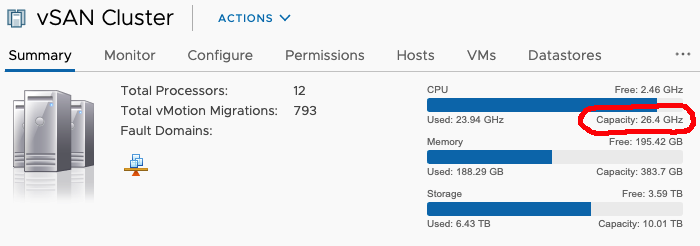
VMware vSphere measures cumulative compute capacity of a cluster which is more tangible than percentage of CPU utilization. In my home lab I have 26.2 GHz of CPU capacity, which is derived as follows:
- 3 Supermicro SuperServer E300-8D servers each with an Intel Xeon D-1518 CPU
- Each Intel Xeon D-1518 CPU has 4 cores running @ 2.20 GHz
- Total cluster compute power 26.2 GHz = 3 servers * 4 cores/each * 2.20 GHz
Baseline energy use – prior to donating compute resources
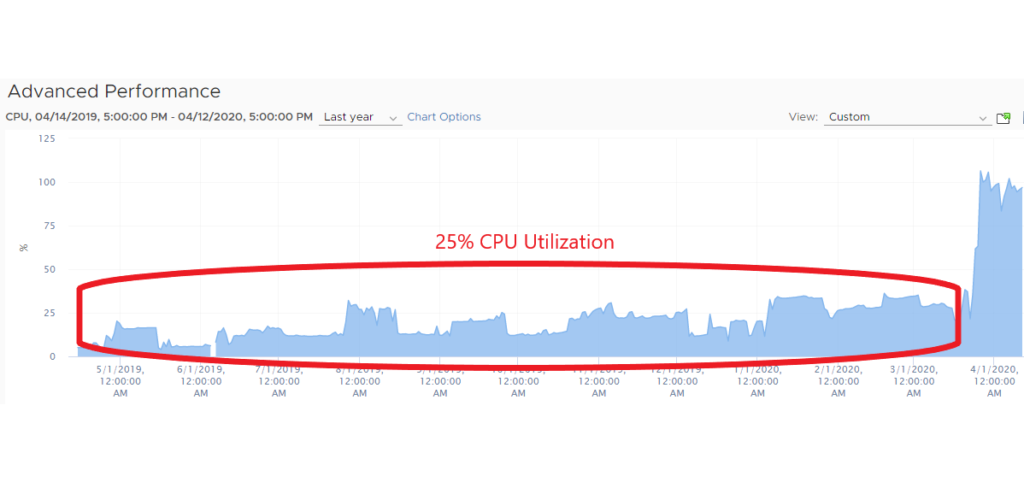
A 25% CPU utilization baseline prior to donating resources was used from eyeballing the vSphere annual home lab CPU performance graph above. The baseline consumes 6.6 Ghz of compute, which is derived by taking 25% (CPU capacity) of 26.4 GHz total cluster capacity. CyperPower UPS PowerPanel software reported the electricity cost averaged $21.56 per month for 177 kilowatts during the baseline time period. Puget Sound Energy supplies electricity @ $0.122/kwh including all taxes.
Incremental energy use after donating spare capacity
A surplus of 19.8 Ghz of compute capacity is unused in the cluster, which is the 75% of capacity.
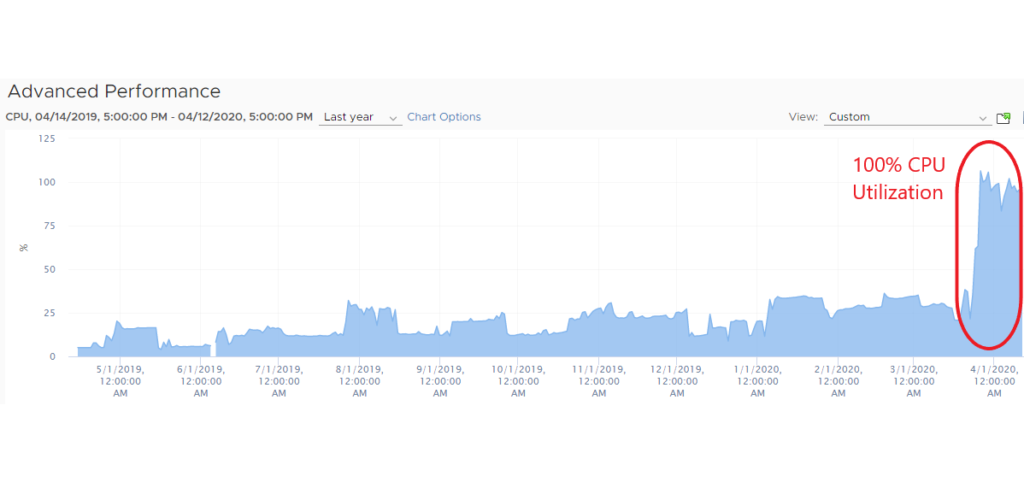
The sharp increase to 100% CPU utilization on the far right of the graph is from donating computer resources through Folding@home fling and Rosetta@home. The entire home lab infrastructure including servers running 7 days a week, 24 hours a day consumes the majority of the energy even if it has a light load. The additional 19.8 GHz of compute work across all 3 servers barely increased electricity costs by $1.80 per 5 kilowatts.
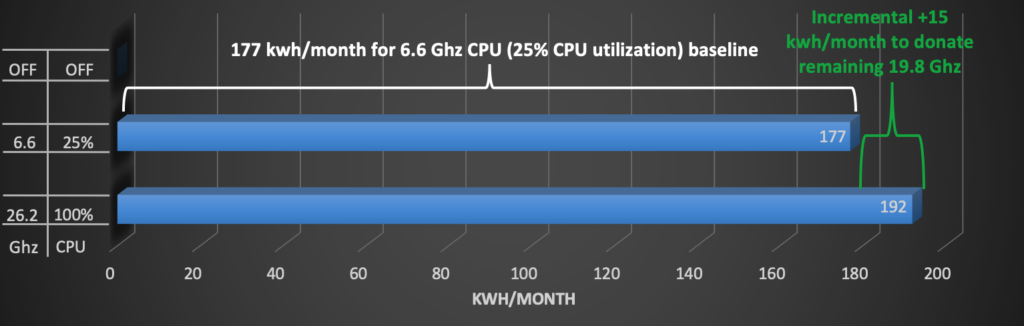
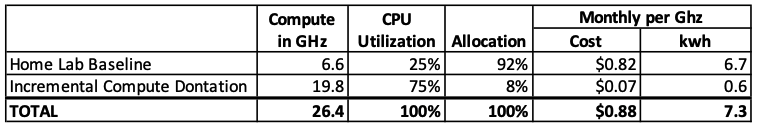
The graph & table below illustrates how donating an incremental 19.8 Ghz of compute results in a disproportionately small increase in electricity usage. This seems counter intuitive prior to analyzing the data.
The baseline workload consumed the majority of the electricity usage prior to increasing utilization. This illustrates how underutilized data centers waste a majority of their capacity and energy. Utilizing all of the computing capacity is extremely efficient.
A “Muscle Car” Home Lab
Many purchase retired enterprise class servers on eBay to build a home lab. Used enterprise class servers are inexpensive to purchase compared to buying new. Computer enthusiasts enjoy these big iron servers with many blinking lights and loud whirling fans. That’s a lot like how car enthusiasts treasure a muscle car with a powerful engine. These servers have large power supplies with a maximum rating of 400-900 watts.
The power outlet for my home lab is a typical shared 20 amp residential circuit. Three enterprise class servers pulling 900 watts would require a 22.5 amp circuit @ 120 volts. This power demand would require new electrical wiring and specialized receptacles installed by an electrician. A much larger UPS would also be required. Enterprise servers generate a lot of heat and noise from the cooling fans.
One of my co-workers has an exhaust fan which draws the heat from his enterprise servers into a vented attic. Snow doesn’t accumulate on his roof above his home lab due to the heat generated.
I don’t expect enterprise class servers to double their electricity usage if the server is already continuously running. I anticipate that the same pattern would exist, where incremental compute resources for Folding@home would have a small energy footprint.
If donating compute time changes the home lab usage pattern it would consume much more energy and easily result in a doubling of an electric bill. Turning on a home lab only for testing, education and practice is a much different use pattern than running a home lab continuously.
A “Green” Home Lab
A goal for my home lab was running it continuously, 24 hours a day, and 7 days a week. Energy efficiency or “Green” became a goal for my home lab after performing an energy cost comparison. A used enterprise server with a low server purchase price could become the most expensive option after assessing the total cost including larger UPS, new high amperage circuits, cooling, and continuous electricity use over many years.
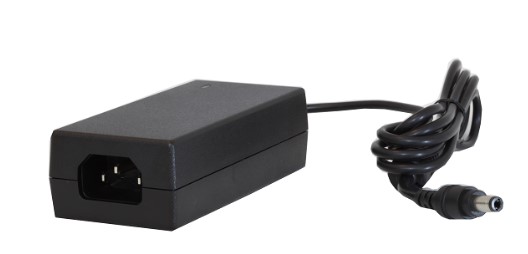
The SuperMicro SuperServer E300-8D’s in my home lab have laptop sized power supplies with a maximum rating of 84 watts. This power supply is approximately 10% to 20% of the capacity of an enterprise server power supply.
These power supplies are compliance with US Department of Energy efficiency level VI which was went into effect in 2016.
This standard requires at least 88% efficiency and the remainder is wasted as heat. Less heat will make it difficult to melt snow on your roof but results in a more sustainable home lab.
My entire home lab including all of the storage, networking hardware, 2 mini infrastructure servers, and 3 lab servers uses less power than 1 enterprise class server.
Don’t Stop Running
When I ran the Seattle Marathon, I noticed at mile 19 people around me stopped running and began walking up Capitol Hill from the flat ground along Lake Washington. I repeated saying “keep on running” to myself so I could finish the marathon and keep the momentum going.
Donating excess computer resources in my example is close to free. It inexpensively provides a great deal of value to researchers. Due to the low incremental cost of energy and money, I have the motivation to continue running this long marathon.